Figure 8
How does a Personalized Rehabilitative Model influence the Functional Response of Different Ankle Foot Orthoses in a Cohort of Patients Affected by Neurological Gait Pattern?
Maurizio Falso*, Eleonora Cattaneo, Elisa Foglia, Marco Zucchini and Franco Zucchini
Published: 30 August, 2017 | Volume 1 - Issue 2 | Pages: 072-092

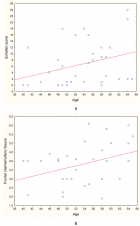
Figure 8:
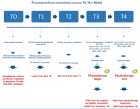
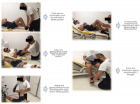
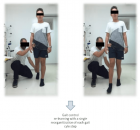
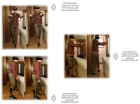
Comparative trend of the mean values of the stride length on the left side (see the left figure) and of the double gait support duration on the left side (see figure on the right side) at time T3 vs time T4 with a relative evidence of the linear trend for each study condition per time.
Read Full Article HTML DOI: 10.29328/journal.jnpr.1001010 Cite this Article Read Full Article PDF
More Images
Similar Articles
-
How does a Personalized Rehabilitative Model influence the Functional Response of Different Ankle Foot Orthoses in a Cohort of Patients Affected by Neurological Gait Pattern?Maurizio Falso*, Eleonora Cattaneo,Elisa Foglia,Marco Zucchini,Franco Zucchini. How does a Personalized Rehabilitative Model influence the Functional Response of Different Ankle Foot Orthoses in a Cohort of Patients Affected by Neurological Gait Pattern?. . 2017 doi: 10.29328/journal.jnpr.1001010; 1: 072-092
Recently Viewed
-
Comparison of Effect of Intrathecal Fentanyl 25µg with 0.5% Hyperbaric Bupivacaine and Only 0.5% Hyperbaric BupivacaineParveen Gafla*. Comparison of Effect of Intrathecal Fentanyl 25µg with 0.5% Hyperbaric Bupivacaine and Only 0.5% Hyperbaric Bupivacaine. Int J Clin Anesth Res. 2025: doi: 10.29328/journal.ijcar.1001029; 9: 017-022
-
Impact of Moringa oleifera Leaf Flour supplement on Weight Gain in Moderately Acutely Malnourished Children in BeninLaleye Flora Tinouade Founmilayo*, Fanou Fogny Nadia and Kayode Polycarpe. Impact of Moringa oleifera Leaf Flour supplement on Weight Gain in Moderately Acutely Malnourished Children in Benin. Arch Food Nutr Sci. 2023: doi: 10.29328/journal.afns.1001052; 7: 070-077
-
Drug Rehabilitation Centre-based Survey on Drug Dependence in District Shimla Himachal PradeshKanishka Saini,Palak Sharma,Bhawna Sharma*,Atul Kumar Dubey,Muskan Bhatnoo,Prajkta Thakur,Vanshika Chandel,Ritika Sinha. Drug Rehabilitation Centre-based Survey on Drug Dependence in District Shimla Himachal Pradesh. J Addict Ther Res. 2025: doi: 10.29328/journal.jatr.1001032; 9: 001-006
-
Feature Processing Methods: Recent Advances and Future TrendsShiying Bai,Lufeng Bai*. Feature Processing Methods: Recent Advances and Future Trends. J Clin Med Exp Images. 2025: doi: 10.29328/journal.jcmei.1001035; 9: 010-014
-
Relationship between Vitamin D Deficiency and Lipopolysaccharides Porphyromonas gingivalis Bacteria in Stunting ChildrenErwin Gunawan*,Ria Puspitawati. Relationship between Vitamin D Deficiency and Lipopolysaccharides Porphyromonas gingivalis Bacteria in Stunting Children. Ann Biomed Sci Eng. 2024: doi: 10.29328/journal.abse.1001033; 8: 059-065
Most Viewed
-
Evaluation of Biostimulants Based on Recovered Protein Hydrolysates from Animal By-products as Plant Growth EnhancersH Pérez-Aguilar*, M Lacruz-Asaro, F Arán-Ais. Evaluation of Biostimulants Based on Recovered Protein Hydrolysates from Animal By-products as Plant Growth Enhancers. J Plant Sci Phytopathol. 2023 doi: 10.29328/journal.jpsp.1001104; 7: 042-047
-
Sinonasal Myxoma Extending into the Orbit in a 4-Year Old: A Case PresentationJulian A Purrinos*, Ramzi Younis. Sinonasal Myxoma Extending into the Orbit in a 4-Year Old: A Case Presentation. Arch Case Rep. 2024 doi: 10.29328/journal.acr.1001099; 8: 075-077
-
Feasibility study of magnetic sensing for detecting single-neuron action potentialsDenis Tonini,Kai Wu,Renata Saha,Jian-Ping Wang*. Feasibility study of magnetic sensing for detecting single-neuron action potentials. Ann Biomed Sci Eng. 2022 doi: 10.29328/journal.abse.1001018; 6: 019-029
-
Pediatric Dysgerminoma: Unveiling a Rare Ovarian TumorFaten Limaiem*, Khalil Saffar, Ahmed Halouani. Pediatric Dysgerminoma: Unveiling a Rare Ovarian Tumor. Arch Case Rep. 2024 doi: 10.29328/journal.acr.1001087; 8: 010-013
-
Physical activity can change the physiological and psychological circumstances during COVID-19 pandemic: A narrative reviewKhashayar Maroufi*. Physical activity can change the physiological and psychological circumstances during COVID-19 pandemic: A narrative review. J Sports Med Ther. 2021 doi: 10.29328/journal.jsmt.1001051; 6: 001-007

HSPI: We're glad you're here. Please click "create a new Query" if you are a new visitor to our website and need further information from us.
If you are already a member of our network and need to keep track of any developments regarding a question you have already submitted, click "take me to my Query."


