Figure 4
Postural Stability Induced by Supervised Physical Training may improve also Oxygen Cost of Exercise and Walking Capacity in Post-Menopause, Obese Women
Fernanda Velluzzi, Massimiliano Pau, Andrea Loviselli, Raffaele Milia, Daniela Lai, Daniele Concu, Gianmarco Angius, Abdallah Raweh, Andrea Fois and Alberto Concu*
Published: 09 January, 2017 | Volume 1 - Issue 1 | Pages: 001-011
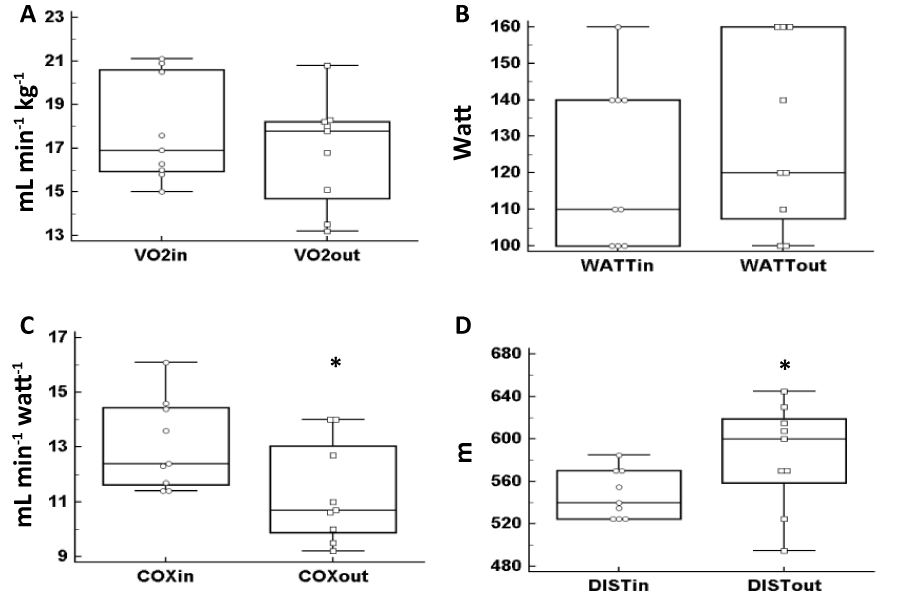
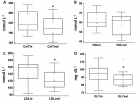
Figure 4:
Box and whiskers plots represent the distribution of data assessed before (in) and after (out) the exercise training and concern oxygen consumption (VO2, 4A), workload (WATT, 4B), oxidative cost (COX, 4C) assessed at the end of incremental cardiopulmonary test, and distance covered in the six minute walk test (DIST, 4D). (*) With respect the in box: difference statistically significant.
Read Full Article HTML DOI: 10.29328/journal.jnpr.1001001 Cite this Article Read Full Article PDF
More Images
Similar Articles
-
Neuromuscular Training in Football: A Literature ReviewCarlos Álvarez-Serrano, Juan Alfaro-Segovia, Eduardo Guzmán-Muñoz, Miguel Alarcón-Rivera*. Neuromuscular Training in Football: A Literature Review. . 2023 doi: 10.29328/journal.jnpr.1001055; 7: 039-047
-
Effect of Lower Extremity Training in Diabetic Peripheral NeuropathyAnn Reena Rajan*. Effect of Lower Extremity Training in Diabetic Peripheral Neuropathy. . 2024 doi: 10.29328/journal.jnpr.1001056; 8: 001-004
Recently Viewed
-
Ra-223 dichloride management in a Nuclear Medicine Unit: experience of a referral institutionGiulia Anna Follacchio*,Viviana Frantellizzi,Francesco Monteleone,Giuseppe De Vincentis,Mauro Liberatore. Ra-223 dichloride management in a Nuclear Medicine Unit: experience of a referral institution. J Radiol Oncol. 2017: doi: 10.29328/journal.jro.1001010; 1: 069-078
-
Hyperthermia and Breast cancer: A short reviewBora Uysal*. Hyperthermia and Breast cancer: A short review. J Radiol Oncol. 2017: doi: 10.29328/journal.jro.1001011; 1: 079-082
-
Near Complete Response to 177Lu-PSMA-DKFZ-617 Therapy in a Patient with Metastatic Castration Resistant Prostate CancerMadhav Prasad Yadav,Sanjana Ballal a,Chandrasekhar Bal*. Near Complete Response to 177Lu-PSMA-DKFZ-617 Therapy in a Patient with Metastatic Castration Resistant Prostate Cancer. J Radiol Oncol. 2017: doi: 10.29328/journal.jro.1001012; 1: 083-086
-
Synthesis, Radioiodination and Biological distribution of 5-(5-(tributylstannyl) benzofuran-2-yl) pyridin-2-amine as an amyloid imaging agentAtteyat A Labib*,Mohsen B Challan. Synthesis, Radioiodination and Biological distribution of 5-(5-(tributylstannyl) benzofuran-2-yl) pyridin-2-amine as an amyloid imaging agent. J Radiol Oncol. 2017: doi: 10.29328/journal.jro.1001013; 1: 087-093
-
Nematophagous Fungus: Pochonia chlamydosporia and Duddingtonia flagrans in the Control of Helminths in Laying Hens (Gallus gallus domesticus) Genus Hy-line Brown - Evaluation and EffectivenessIsabella Allana Ferreira*,Júlia dos Santos Fonseca,Ítalo Stoupa Vieira,Lorendane Millena de Carvalho,Jackson Victor de Araújo. Nematophagous Fungus: Pochonia chlamydosporia and Duddingtonia flagrans in the Control of Helminths in Laying Hens (Gallus gallus domesticus) Genus Hy-line Brown - Evaluation and Effectiveness. Insights Vet Sci. 2025: doi: 10.29328/journal.ivs.1001046; 9: 001-007
Most Viewed
-
Feasibility study of magnetic sensing for detecting single-neuron action potentialsDenis Tonini,Kai Wu,Renata Saha,Jian-Ping Wang*. Feasibility study of magnetic sensing for detecting single-neuron action potentials. Ann Biomed Sci Eng. 2022 doi: 10.29328/journal.abse.1001018; 6: 019-029
-
Evaluation of In vitro and Ex vivo Models for Studying the Effectiveness of Vaginal Drug Systems in Controlling Microbe Infections: A Systematic ReviewMohammad Hossein Karami*, Majid Abdouss*, Mandana Karami. Evaluation of In vitro and Ex vivo Models for Studying the Effectiveness of Vaginal Drug Systems in Controlling Microbe Infections: A Systematic Review. Clin J Obstet Gynecol. 2023 doi: 10.29328/journal.cjog.1001151; 6: 201-215
-
Prospective Coronavirus Liver Effects: Available KnowledgeAvishek Mandal*. Prospective Coronavirus Liver Effects: Available Knowledge. Ann Clin Gastroenterol Hepatol. 2023 doi: 10.29328/journal.acgh.1001039; 7: 001-010
-
Causal Link between Human Blood Metabolites and Asthma: An Investigation Using Mendelian RandomizationYong-Qing Zhu, Xiao-Yan Meng, Jing-Hua Yang*. Causal Link between Human Blood Metabolites and Asthma: An Investigation Using Mendelian Randomization. Arch Asthma Allergy Immunol. 2023 doi: 10.29328/journal.aaai.1001032; 7: 012-022
-
An algorithm to safely manage oral food challenge in an office-based setting for children with multiple food allergiesNathalie Cottel,Aïcha Dieme,Véronique Orcel,Yannick Chantran,Mélisande Bourgoin-Heck,Jocelyne Just. An algorithm to safely manage oral food challenge in an office-based setting for children with multiple food allergies. Arch Asthma Allergy Immunol. 2021 doi: 10.29328/journal.aaai.1001027; 5: 030-037

HSPI: We're glad you're here. Please click "create a new Query" if you are a new visitor to our website and need further information from us.
If you are already a member of our network and need to keep track of any developments regarding a question you have already submitted, click "take me to my Query."


